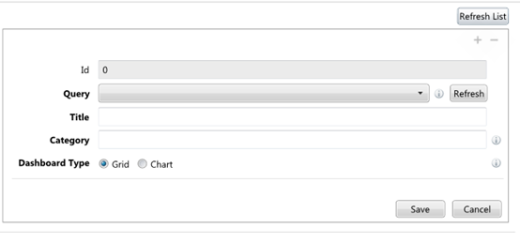
To create a chart within MiiNT the below information must be completed:
The table below list the fields for dashboard charts.
| Fields | Description |
|---|---|
|
Id |
The unique identifier of the dashboard chart, which is automatically generated when a record is created. This Id is used on the Dashboard Chart View page to display the chart. |
|
Query |
The report query that provides the data for the chart. |
|
Title |
The title of the dashboard, that will appear in the Dashboards – Administration list and when the chart is displayed. |
|
Category |
Set this to the page in MiiNT where the dashboard will be displayed. Refer to the Category topic for more details on categories. |
|
Dashboard Type |
Set this to Chart. |
|
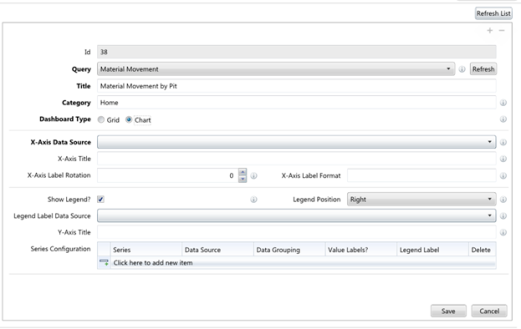
X-Axis Data Source |
Select the output field from the report query to provide data for the X-Axis. |
|
X-Axis Title |
Enter the title to be displayed to the X-Axis of the chart. |
|
X-Axis Label Rotation |
Enter a value indicating the rotation angle for the X-axis labels. Useful when label texts are long, so they do not overlap each-other. |
|
X-Axis Label Format |
Enter formatting to be applied to the X-Axis label i.e. d-MMM for 7-May |
|
Show Legend? |
Select to display a legend on the chart. |
|
Legend Position |
Select the position to show the legend on the chart. |
|
Legend Label Data Source |
Select the output field from the report query to provide data for the legend label. |
|
Y-Axis Title |
Enter the title to be displayed to the Y-Axis of the chart. |
|
Series Configuration |
This is where you configure the series to be used to chart the data. Note: It can be configured for more than one series. |
|
|
Click this button to add a new series. |
Note: Field labels highlighted as bold must have a value entered or selected as they are mandatory.
To create a chart series within MiiNT the below information must be completed:
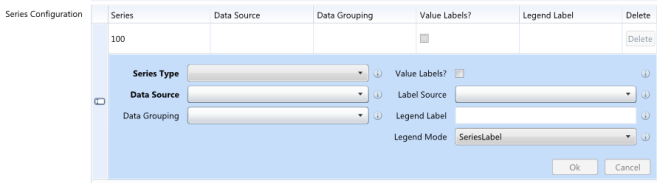
The table below list the fields for a series configuration of a dashboard chart.
| Fields | Description |
|---|---|
|
Series Type |
Select the type of series to be used to display the data on the chart. Refer to the Series Overview topic for explanation of the different series types and their use. |
|
Data Source |
Select the output field from the report query to provide data for the series. |
|
Data Grouping |
Select the output field from the report query to group the series data. For example:
|
|
Value Labels? |
Select to display value labels for data points on a chart. |
|
Label Source |
Select the data to be used for data point labels. |
|
Legend Label |
Enter the name to be displayed for the series legend. |
|
Legend Mode |
Select the way to map the legend to the data series:
|
Note: Field labels highlighted as bold must have a value entered or selected as they are mandatory.