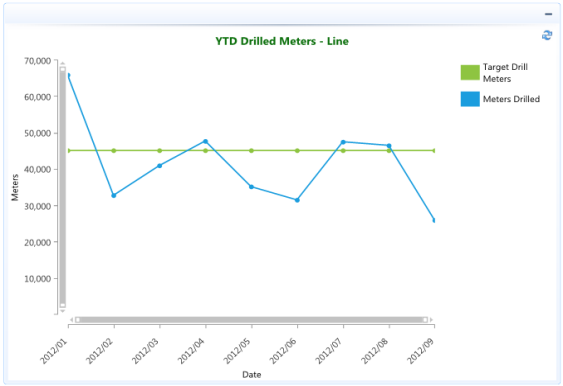
This chart type displays a set of data points connected by a line. A common use for the line chart is to show trends over a period of time.
In the example below the actual meters drilled are compared to the YTD monthly target drill meters using lines on a chart.