AreaStacked 100% charts are a variation of Area Stacked charts that present values for trends as percentages, totaling to 100% for each category.
Use this chart type to visualize data that fluctuates over a period of time and where the relationship between values in a category is more significant than the amounts.
An area stacked chart displays series stacked as a set of points connected by a line, with an area filled in below the line.
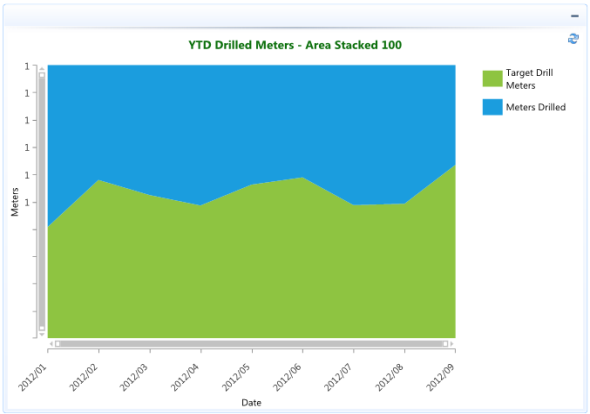
In the example below the actual meters drilled area is compared to and stacked above the YTD monthly target drill meters area and proportioned over a 100%.