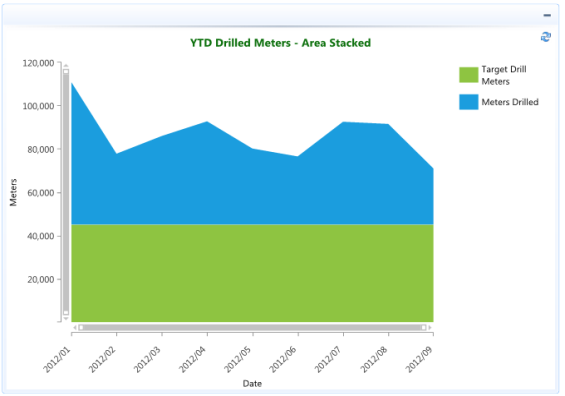
The AreaStacked chart is a variation of the Area chart that display trends of the contribution of each value over time (or across categories). The areas are stacked so that each series adjoins but does not overlap the preceding series.
Area stacked charts are appropriate for visualizing data that fluctuates over a period of time and where the entire area for all series data must be visible at one time.
An area stacked chart displays series stacked as a set of points connected by a line, with an area filled in below the line.
In the example below the actual meters drilled area is compared to and stacked above the YTD monthly target drill meters area.
