Spline charts allow you to take a limited set of known data points and approximate intervening values.
The Spline chart is often used for data modeling by taking a limited number of data points and interpolating or estimating the intervening values.
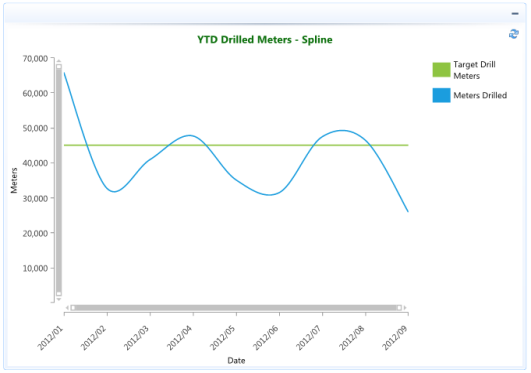
In the example below the actual meters drilled are compared to the YTD monthly target drill meters using splines on a chart.