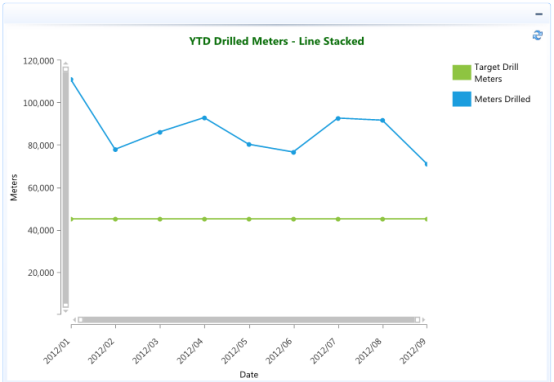
This chart type displays sets of data points connected by lines. Used to show two line series, with one stacked on top of the other.
In the example below the actual meters drilled are compared to the YTD monthly target drill meters using lines on a chart, with the actual meters drilled line stacked on top of the target drill meters.